Data Analysis & Forecasting in FMCG
Quote from bsdinsight on 6 April 2025, 09:46Data Analysis & Forecasting in FMCG
For Forecast Analysts Who Want to Simplify ComplexityThere’s a quote often thrown around in our world:
“There are three kinds of lies – lies, damned lies, and statistics.”
Funny, but also a warning — if misused, even good data can lead us astray.That’s why in the FMCG industry, where speed and accuracy matter, we need to turn data into insightful, actionable forecasts — not just numbers on a screen.
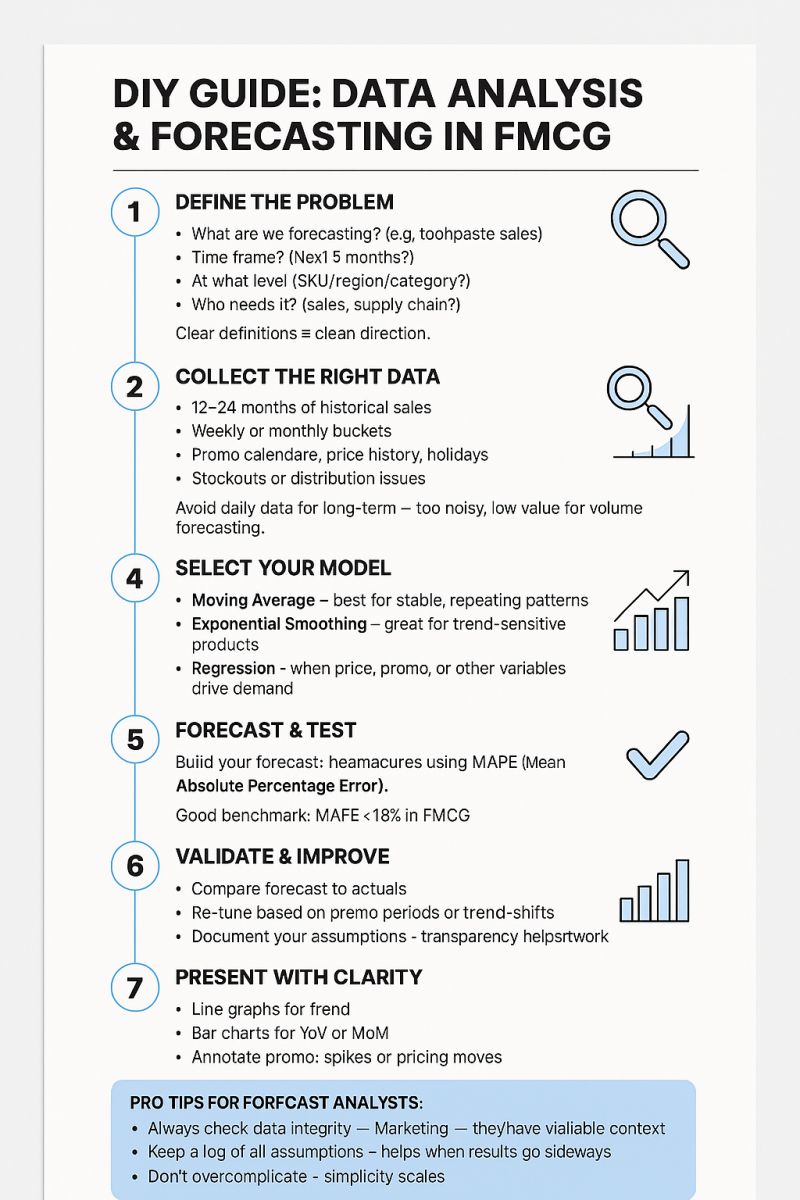
1. Define the Problem
🔍 Ask:
What are we forecasting? (e.g., toothpaste sales)
Time frame? (Next 6 months?)
At what level? (SKU/region/category?)
Who needs it? (Sales, supply chain?)
Clear definitions = clean direction.
2. Collect the Right Data
📊 What to gather:
12–24 months of historical sales
Weekly or monthly buckets
Promo calendars, price history, holidays
Stockouts or distribution issues
Tip: Avoid daily data for long-term — too noisy, low value for volume forecasting.
3. Analyze the Data
🔍 A. Spot the trend
Use simple Moving Average to smooth ups and downs:=AVERAGE(B2:B4)
📈 B. Detect seasonality
Look for spikes during holidays, back-to-school, etc.
Use Excel line charts to make it visual.⚠️ C. Find outliers
Big jump? Was there a promo or price drop? Explain the anomaly.4. Select Your Model
⚙️ Start simple and go deeper as needed:
Moving Average – best for stable, repeating patterns
Exponential Smoothing – great for trend-sensitive products
Regression – when price, promo, or other variables drive demand
5. Forecast & Test
📈 Build your forecast using the model you trust.
🧪 Measure performance using: MAPE (Mean Absolute Percentage Error)
Good benchmark: MAPE < 15% in FMCG.6. Validate & Improve
✅ Compare your forecast to actuals.
✅ Re-tune based on promo periods or trend shifts.
✅ Document your assumptions — transparency helps teamwork.7. Present with Clarity
✨ Visualize the outcome:
Line graphs for trend
Bar charts for YoY or MoM
Annotate promo spikes or pricing moves
Pro Tips for Forecast Analysts:
✅ Always check data integrity
✅ Collaborate with Sales & Marketing – they have valuable context
✅ Keep a log of all assumptions – helps when results go sideways
✅ Don’t overcomplicate – simplicity scales
Data Analysis & Forecasting in FMCG
For Forecast Analysts Who Want to Simplify Complexity
There’s a quote often thrown around in our world:
“There are three kinds of lies – lies, damned lies, and statistics.”
Funny, but also a warning — if misused, even good data can lead us astray.
That’s why in the FMCG industry, where speed and accuracy matter, we need to turn data into insightful, actionable forecasts — not just numbers on a screen.
1. Define the Problem
🔍 Ask:
What are we forecasting? (e.g., toothpaste sales)
Time frame? (Next 6 months?)
At what level? (SKU/region/category?)
Who needs it? (Sales, supply chain?)
Clear definitions = clean direction.
2. Collect the Right Data
📊 What to gather:
12–24 months of historical sales
Weekly or monthly buckets
Promo calendars, price history, holidays
Stockouts or distribution issues
Tip: Avoid daily data for long-term — too noisy, low value for volume forecasting.
3. Analyze the Data
🔍 A. Spot the trend
Use simple Moving Average to smooth ups and downs:
=AVERAGE(B2:B4)
📈 B. Detect seasonality
Look for spikes during holidays, back-to-school, etc.
Use Excel line charts to make it visual.
⚠️ C. Find outliers
Big jump? Was there a promo or price drop? Explain the anomaly.
4. Select Your Model
⚙️ Start simple and go deeper as needed:
Moving Average – best for stable, repeating patterns
Exponential Smoothing – great for trend-sensitive products
Regression – when price, promo, or other variables drive demand
5. Forecast & Test
📈 Build your forecast using the model you trust.
🧪 Measure performance using: MAPE (Mean Absolute Percentage Error)
Good benchmark: MAPE < 15% in FMCG.
6. Validate & Improve
✅ Compare your forecast to actuals.
✅ Re-tune based on promo periods or trend shifts.
✅ Document your assumptions — transparency helps teamwork.
7. Present with Clarity
✨ Visualize the outcome:
Line graphs for trend
Bar charts for YoY or MoM
Annotate promo spikes or pricing moves
Pro Tips for Forecast Analysts:
✅ Always check data integrity
✅ Collaborate with Sales & Marketing – they have valuable context
✅ Keep a log of all assumptions – helps when results go sideways
✅ Don’t overcomplicate – simplicity scales