Forum breadcrumbs – You are here:ForumGiải pháp BSD cung cấp: Power BIRevenue Performance Dashboard Ana …
Revenue Performance Dashboard Analysis
bsdinsight@bsdinsight-com
837 Posts
#1 · 5 May 2025, 08:19
Quote from bsdinsight on 5 May 2025, 08:19Revenue Performance Dashboard Analysis: Insights for Leadership
Overview of the Dashboard
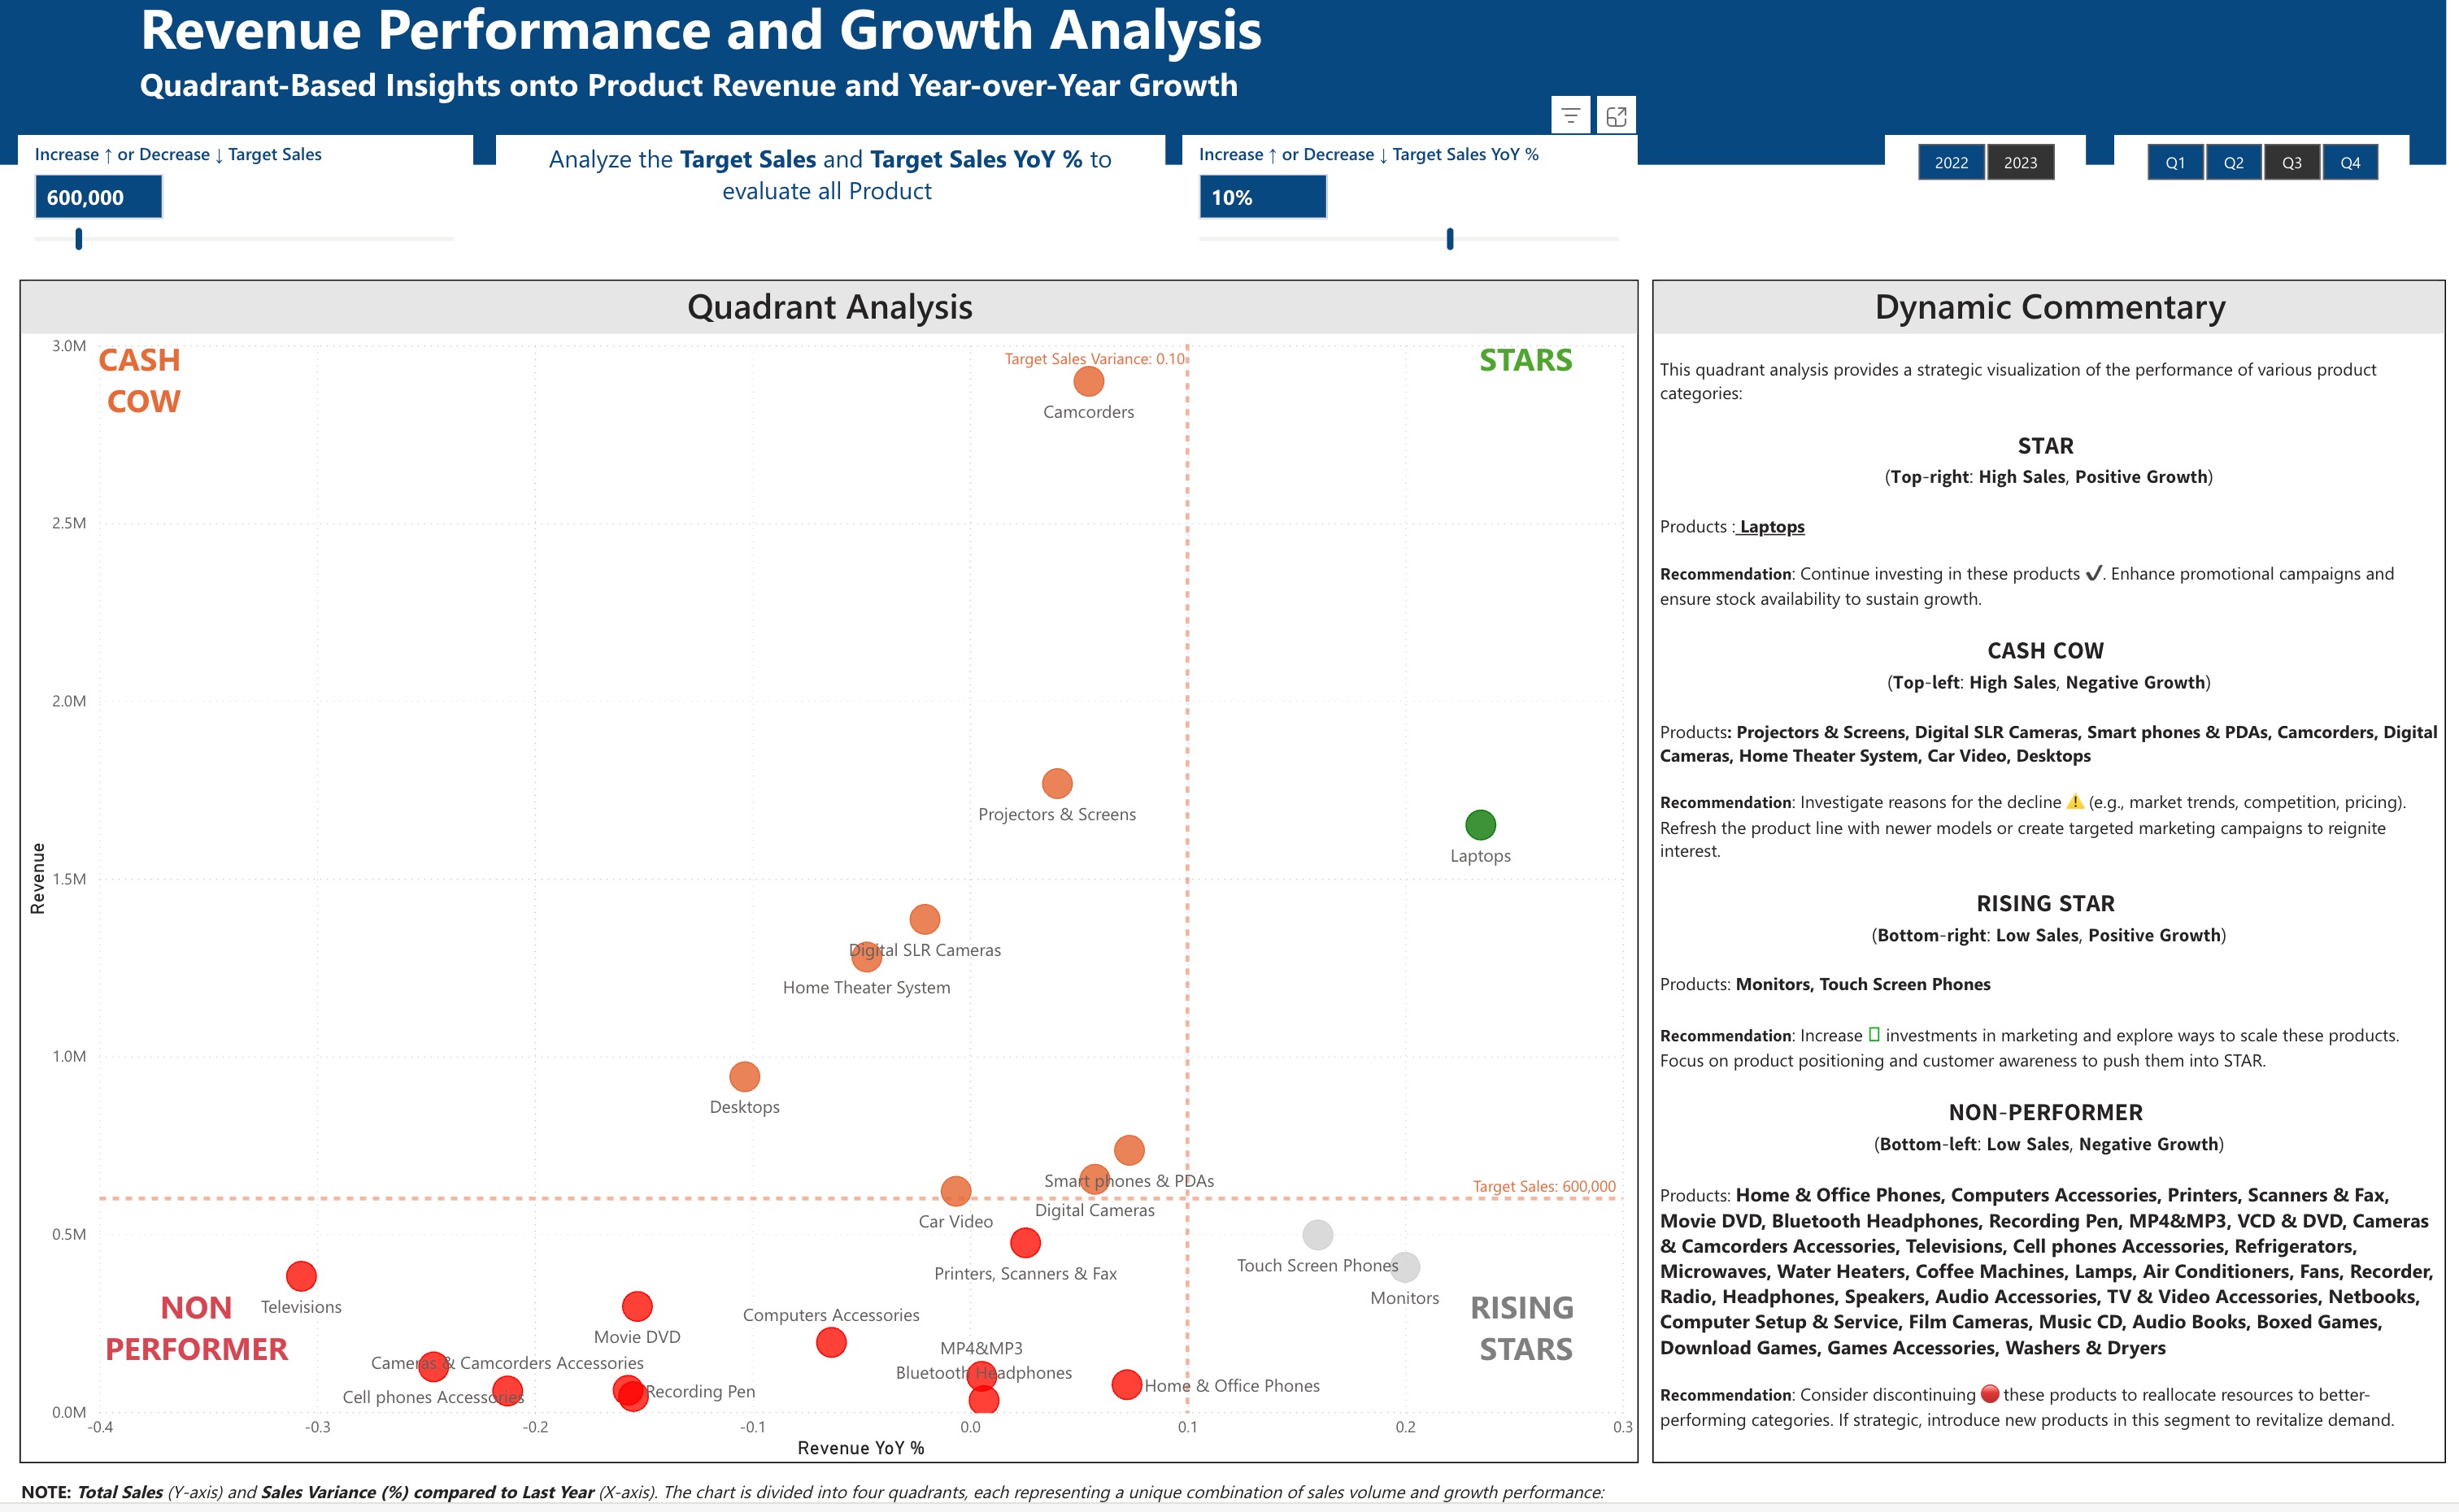
This dashboard, titled “Revenue Performance and Growth Analysis,” provides a quadrant-based visualization of product performance based on two key metrics: Target Sales (Y-axis) and Target Sales Year-over-Year (YoY) Growth (X-axis). The quadrants categorize products into four groups:
Benefits for Leadership
This dashboard offers several strategic advantages for leadership:
Key Metrics and Areas for Improvement
The dashboard highlights critical metrics that businesses should focus on:
Expert Opinions
According to business strategist Michael Porter, “Understanding competitive positioning requires a clear view of where your products stand in terms of market performance and growth potential.” This dashboard aligns with Porter’s framework by providing a visual representation of product positioning, enabling leaders to make informed decisions about resource allocation and innovation.Marketing expert Philip Kotler emphasizes the importance of lifecycle management: “Products in decline (Cash Cows with negative growth) need either reinvention or phased withdrawal to optimize portfolio performance.” Leadership should heed this advice by investigating reasons for the decline in categories like Camcorders and considering new features or markets to rejuvenate them.Example: Application in the Real Estate Industry
In the real estate sector, a similar dashboard can be adapted to evaluate property types or projects:
Conclusion
The Revenue Performance and Growth Analysis dashboard is a powerful tool for leadership, offering actionable insights into product performance and growth trends. By focusing on key metrics like Target Sales Variance and YoY Growth, businesses can drive improvements in underperforming areas while capitalizing on growth opportunities. For industries like real estate, this framework can be tailored to evaluate projects and ensure strategic alignment with market demands.
Revenue Performance Dashboard Analysis: Insights for Leadership
Overview of the Dashboard
This dashboard, titled “Revenue Performance and Growth Analysis,” provides a quadrant-based visualization of product performance based on two key metrics: Target Sales (Y-axis) and Target Sales Year-over-Year (YoY) Growth (X-axis). The quadrants categorize products into four groups:
-
Stars (Top-right: High Sales, Positive Growth): Products like Laptops, with high revenue (1.5M) and positive YoY growth (0.2%).
-
Cash Cows (Top-left: High Sales, Negative Growth): Products like Projectors & Screens, Camcorders, and Digital SLR Cameras, showing high revenue (1.5M–2.0M) but declining growth (-0.1% to 0.0%).
-
Rising Stars (Bottom-right: Low Sales, Positive Growth): Products like Monitors and Touch Screen Phones, with lower revenue (0.5M–1.0M) but positive growth (0.1%–0.2%).
-
Non-Performers (Bottom-left: Low Sales, Negative Growth): Products like Home & Office Phones, Computers Accessories, and Printers, with low revenue (0.0M–0.5M) and negative growth (-0.4% to -0.1%).
The chart includes a filter for analyzing Target Sales (ranging from 0 to 500,000) and Target Sales YoY Growth (from -10% to 10%), allowing leaders to zoom into specific performance thresholds. Additionally, the dashboard tracks performance across quarters (Q1–Q4) for 2022 and 2023.
Benefits for Leadership
This dashboard offers several strategic advantages for leadership:
-
Clear Performance Segmentation: The quadrant view allows leaders to quickly identify which products are driving revenue (Stars and Cash Cows) and which are underperforming (Non-Performers), enabling data-driven resource allocation.
-
Growth Opportunity Identification: Rising Stars highlight products with growth potential, helping leaders prioritize marketing and development efforts to scale these categories.
-
Risk Mitigation: Non-Performers and Cash Cows with declining growth signal areas needing intervention, such as product innovation or discontinuation.
-
Performance Tracking Over Time: The quarterly filters enable leaders to monitor trends, assess the impact of strategic decisions, and adjust plans dynamically.
Key Metrics and Areas for Improvement
The dashboard highlights critical metrics that businesses should focus on:
-
Target Sales Variance: Currently at 0.0%, indicating that overall sales are meeting expectations. However, leadership should aim for a positive variance (e.g., 5%) to ensure growth exceeds targets.
-
Target Sales YoY Growth: Products in the Non-Performer and Cash Cow quadrants show negative growth (-0.4% to 0.0%). Businesses should target at least 2–3% YoY growth for these categories to prevent revenue decline.
-
Revenue Thresholds: Non-Performers have revenues below 600,000. Businesses should aim to either push these products above this threshold or reallocate resources to higher-performing categories.
Recommendation: Focus on revitalizing Cash Cows (e.g., Projectors & Screens) through targeted marketing campaigns or product updates to regain growth momentum. Simultaneously, invest in Rising Stars (e.g., Monitors) to accelerate their transition into Stars.
Expert Opinions
According to business strategist Michael Porter, “Understanding competitive positioning requires a clear view of where your products stand in terms of market performance and growth potential.” This dashboard aligns with Porter’s framework by providing a visual representation of product positioning, enabling leaders to make informed decisions about resource allocation and innovation.
Marketing expert Philip Kotler emphasizes the importance of lifecycle management: “Products in decline (Cash Cows with negative growth) need either reinvention or phased withdrawal to optimize portfolio performance.” Leadership should heed this advice by investigating reasons for the decline in categories like Camcorders and considering new features or markets to rejuvenate them.
Example: Application in the Real Estate Industry
In the real estate sector, a similar dashboard can be adapted to evaluate property types or projects:
-
Stars: Luxury apartments in prime locations with high sales (e.g., $2M per quarter) and strong YoY growth (5%). Recommendation: Continue heavy marketing and expand similar projects.
-
Cash Cows: Affordable housing projects with high sales ($1.5M) but declining growth (-2%). Recommendation: Introduce modern amenities or flexible payment plans to regain growth.
-
Rising Stars: Co-working space rentals with moderate sales ($500K) but high growth (8%). Recommendation: Scale up by targeting freelancers and startups through digital campaigns.
-
Non-Performers: Rural land plots with low sales ($200K) and negative growth (-5%). Recommendation: Either discontinue or pivot by marketing these plots for eco-tourism or sustainable farming.
By using this quadrant-based approach, real estate leaders can prioritize high-potential projects, optimize declining segments, and make strategic decisions to maximize profitability.
Conclusion
The Revenue Performance and Growth Analysis dashboard is a powerful tool for leadership, offering actionable insights into product performance and growth trends. By focusing on key metrics like Target Sales Variance and YoY Growth, businesses can drive improvements in underperforming areas while capitalizing on growth opportunities. For industries like real estate, this framework can be tailored to evaluate projects and ensure strategic alignment with market demands.
- You need to login to have access to uploads.
Click for thumbs down.0Click for thumbs up.0