Slicers in Power BI
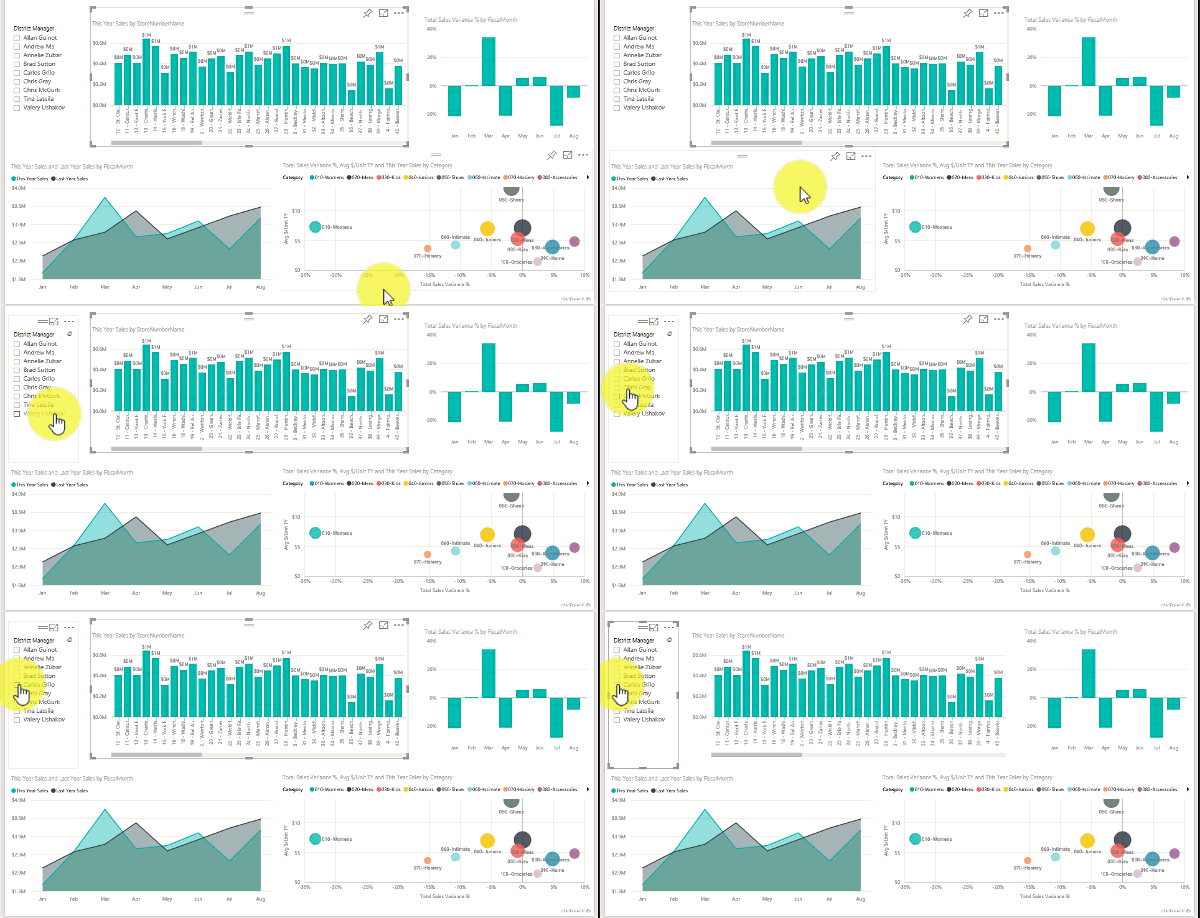
Quote from bsdinsight on 19 November 2023, 10:02Suppose you want your report readers to be able to look at overall sales metrics, but also highlight performance for individual district managers and different time frames. You could create separate reports or comparative charts. You could add filters in the Filters pane. Or you could use slicers. Slicers are another way of filtering. They’re displayed on the report page, and narrow the portion of the semantic model that’s shown in the other report visualizations.
This article walks through creating and formatting a basic slicer, using the free Retail Analysis Sample. It also covers controlling which visuals are affected by a slicer, syncing with slicers on other pages, and filtering and formatting slicers.
These other articles explain how to make specific types of slicers:
- Numeric range slicers.
- Relative date slicers.
- Relative time slicers.
- Responsive, resizable slicers.
- Hierarchy slicers with multiple fields.
When to use a slicer
Slicers are a great choice when you want to:
- Display commonly used or important filters on the report canvas for easier access.
- Make it easier to see the current filtered state without having to open a drop-down list.
- Filter by columns that are unneeded and hidden in the data tables.
- Create more focused reports by putting slicers next to important visuals.
Power BI slicers don’t support:
- Input fields
- Drill-down options
Suppose you want your report readers to be able to look at overall sales metrics, but also highlight performance for individual district managers and different time frames. You could create separate reports or comparative charts. You could add filters in the Filters pane. Or you could use slicers. Slicers are another way of filtering. They’re displayed on the report page, and narrow the portion of the semantic model that’s shown in the other report visualizations.

This article walks through creating and formatting a basic slicer, using the free Retail Analysis Sample. It also covers controlling which visuals are affected by a slicer, syncing with slicers on other pages, and filtering and formatting slicers.
These other articles explain how to make specific types of slicers:
- Numeric range slicers.
- Relative date slicers.
- Relative time slicers.
- Responsive, resizable slicers.
- Hierarchy slicers with multiple fields.
When to use a slicer
Slicers are a great choice when you want to:
- Display commonly used or important filters on the report canvas for easier access.
- Make it easier to see the current filtered state without having to open a drop-down list.
- Filter by columns that are unneeded and hidden in the data tables.
- Create more focused reports by putting slicers next to important visuals.
Power BI slicers don’t support:
- Input fields
- Drill-down options

