5 biểu đồ cần phải custom
Quote from bsdinsight on 20 November 2023, 18:00
Tài liệu liệt kê 5 biểu đồ mà các công cụ phân tích dữ liệu thường không dựng sẵn, mà chúng ta cần phải custom để có được các biểu đồ này. Nhưng thực sự, trong thực tế, các biểu đổ này cũng không thường xuyên dùng
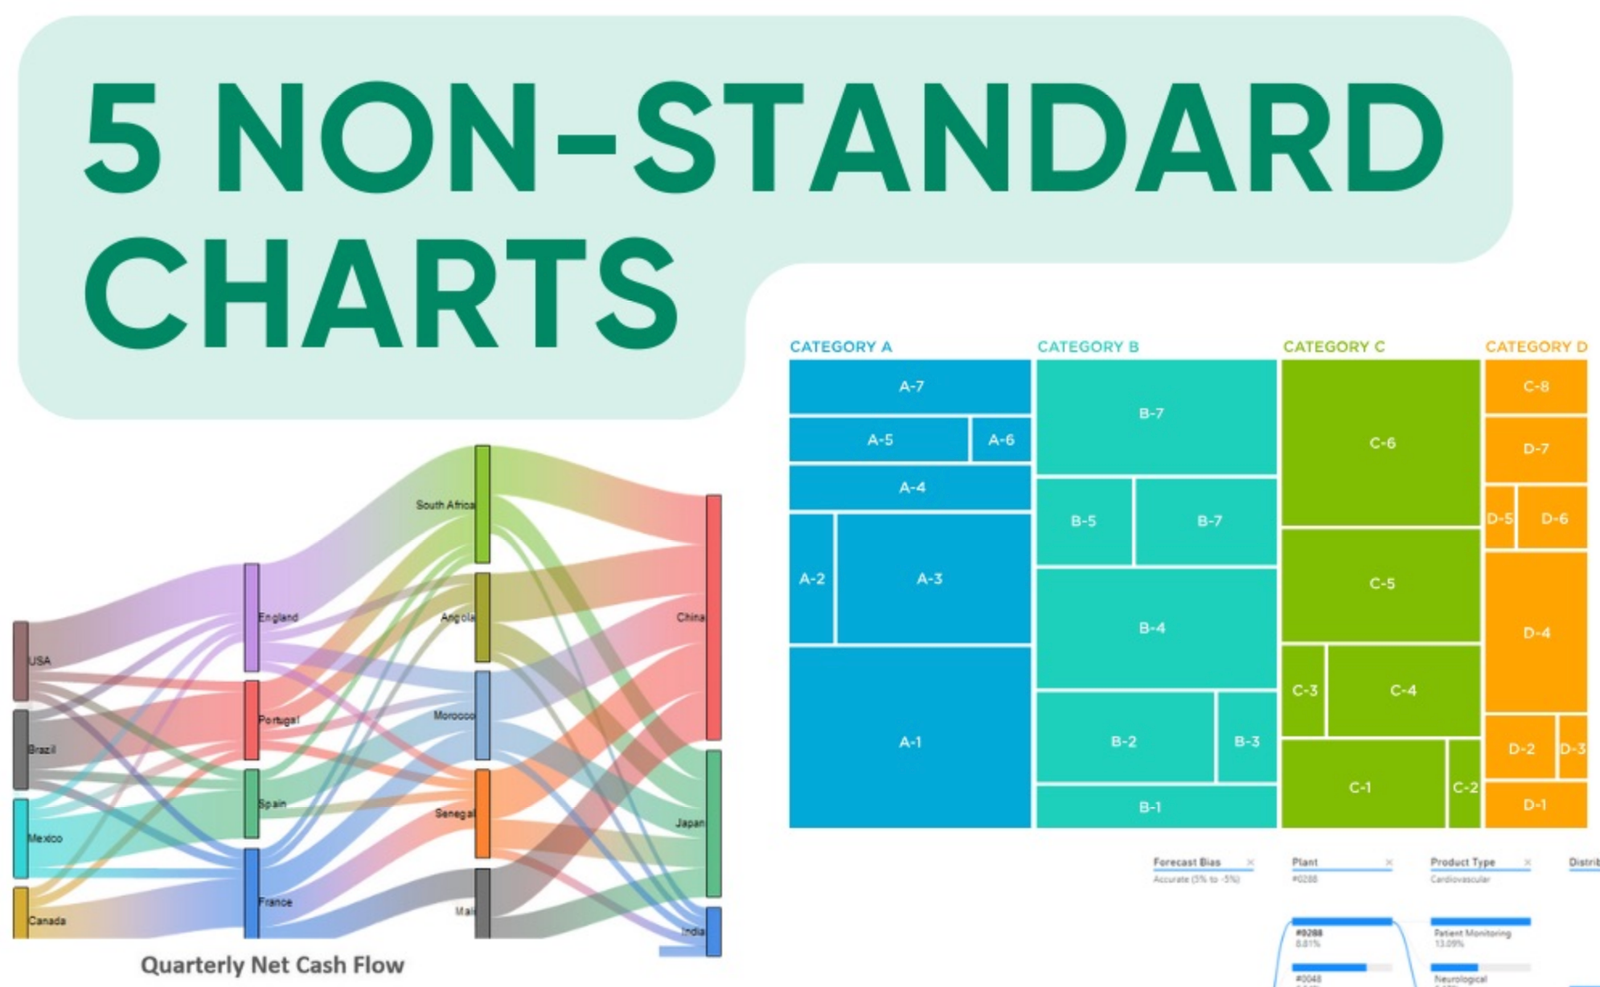
1. Sankey Chart
It visualizes the flow of resources or information between multiple entities. It showcases the magnitude of flow through paths of varying widths.
Sankey is ideal for illustrating energy transfers, budget allocation, or any scenario where you want to showcase the distribution of resources.2. Waterfall Chart
The waterfall chart tracks the cumulative effect of sequentially introduced positive or negative values, leading to a final total. It is perfect for visualizing financial statements, project timelines, or any scenario where you want to show the step-by-step impact of various factors.3. Decomposition Tree
The decomposition tree breaks down a measure into its contributing factors, providing a hierarchical view of the components influencing the overall metric. It is great for exploring the ‘why’ behind a particular metric, understanding the root causes, and identifying areas for improvement.4. Tornado Chart
The tornado visually displays the impact of different variables on a given outcome. It helps identify the most influential factors. It is valuable for sensitivity analysis, risk assessment, or any scenario where you need to prioritize and understand the impact of various variables.5. Treemap
A treemap represents hierarchical data using nested rectangles. Each branch of the tree is depicted by a colored rectangle, offering an efficient space utilization. It is effective for displaying hierarchical structures like file directories, organizational structures, or any data with a nested relationship.These diagrams are not just visually appealing; they are powerful tools for uncovering insights that might be elusive in traditional charts.
Xem và tải tài liệu tại đây
[dflip id="96193" ][/dflip]
Tài liệu liệt kê 5 biểu đồ mà các công cụ phân tích dữ liệu thường không dựng sẵn, mà chúng ta cần phải custom để có được các biểu đồ này. Nhưng thực sự, trong thực tế, các biểu đổ này cũng không thường xuyên dùng
1. Sankey Chart
It visualizes the flow of resources or information between multiple entities. It showcases the magnitude of flow through paths of varying widths.
Sankey is ideal for illustrating energy transfers, budget allocation, or any scenario where you want to showcase the distribution of resources.
2. Waterfall Chart
The waterfall chart tracks the cumulative effect of sequentially introduced positive or negative values, leading to a final total. It is perfect for visualizing financial statements, project timelines, or any scenario where you want to show the step-by-step impact of various factors.
3. Decomposition Tree
The decomposition tree breaks down a measure into its contributing factors, providing a hierarchical view of the components influencing the overall metric. It is great for exploring the ‘why’ behind a particular metric, understanding the root causes, and identifying areas for improvement.
4. Tornado Chart
The tornado visually displays the impact of different variables on a given outcome. It helps identify the most influential factors. It is valuable for sensitivity analysis, risk assessment, or any scenario where you need to prioritize and understand the impact of various variables.
5. Treemap
A treemap represents hierarchical data using nested rectangles. Each branch of the tree is depicted by a colored rectangle, offering an efficient space utilization. It is effective for displaying hierarchical structures like file directories, organizational structures, or any data with a nested relationship.
These diagrams are not just visually appealing; they are powerful tools for uncovering insights that might be elusive in traditional charts.
Xem và tải tài liệu tại đây