Dashboard for your business
Quote from bsdinsight on 12 April 2025, 11:10🔍 Key Features of the Dashboard:
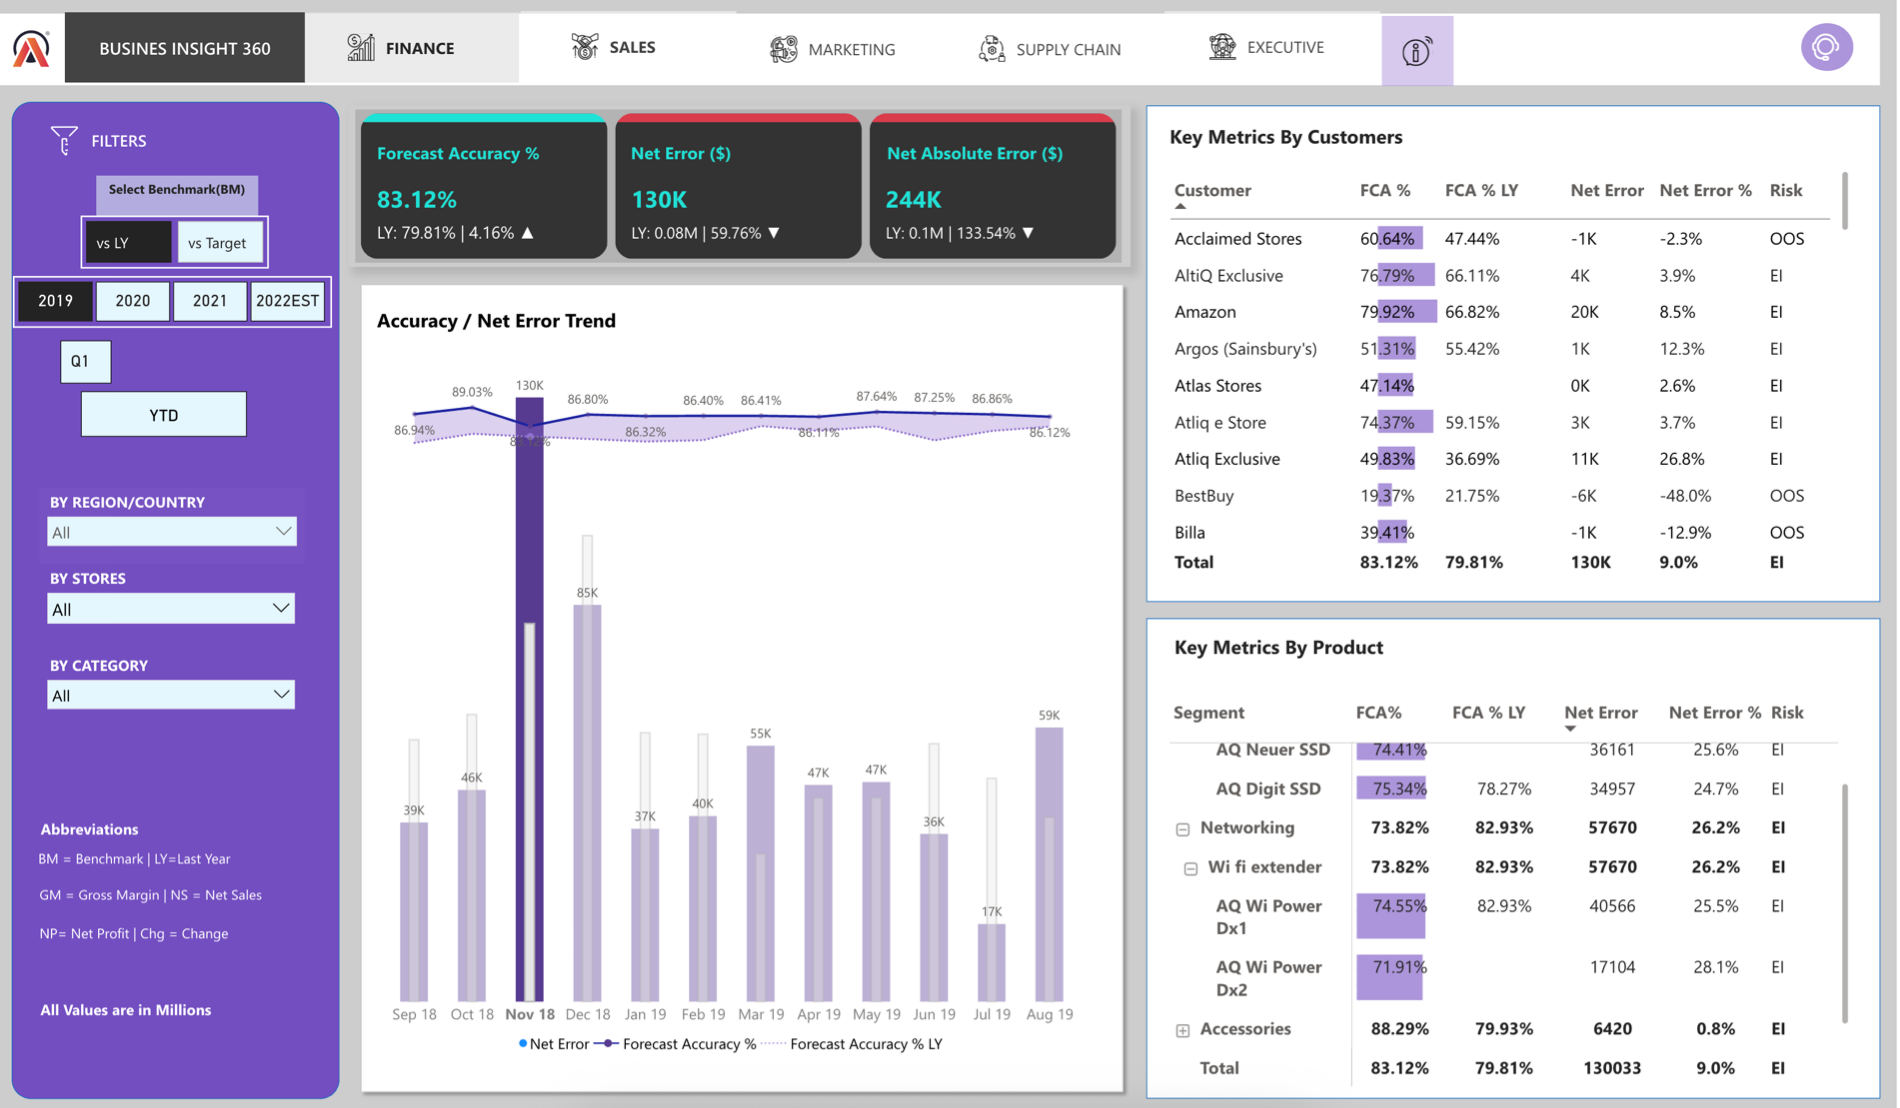
✔️ Finance – Profit & Loss insights across customers, products, and countries.
✔️ Sales – Key performance indicators like Net Sales, Gross Margin, and Profitability Trends.
✔️ Marketing – Product performance analysis and growth opportunities.
✔️ Supply Chain – Forecast accuracy, risk management, and operational efficiency.
✔️ Executive View – High-level summaries for leadership decision-making.
Project Implementation
The development of this Power BI dashboard involved several critical steps, including data extraction, transformation, modeling, and visualization. Below is a detailed overview of the technical implementation.
1- Database Design and Setup : The database serves as the central repository for all business data and ensures consistency and reliability across the platform. Developed a Snowflake schema that organizes data into related tables, optimizing for easy retrieval and analytical performance.
2- Data Extraction and ETL Processes : Data was seamlessly extracted from multiple sources, including MySQL databases and Excel files, ensuring that all relevant business data could be ingested into Power BI. Applied ETL (Extract, Transform, Load) processes to clean, standardize, and transform raw data into valuable, actionable insights. These processes ensured data consistency and improved the quality of the reports generated.
3- Data Modeling : Created an advanced data model using the Snowflake schema, which integrated over ten related tables.
This model enables the efficient and accurate analysis of data across various business domains. Developed calculated columns and measures using DAX (Data Analysis Expressions) to allow for complex business calculations and deeper analytical insights.
4- Visualization and Reporting : Designed interactive visualizations using Power BI, including dashboards, charts, tables, and KPIs, that allow users to explore data dynamically. Leveraged features like slicers, bookmarks, and buttons to create user-friendly, interactive reports that allow stakeholders to drill down into specific data points and view customized views. Integrated Power BI Services for report publishing, making it easy to share insights across teams and departments.
5- Automation & Data Refresh : Implemented automated data refresh using Power BI Gateway, ensuring that the dashboard reflects the latest business data without manual intervention. Scheduled automatic updates to keep the reports up-to-date, ensuring executives and teams always have access to the most current information.
⦁Power BI: Used for creating dynamic dashboards, visualizations, and interactive reports.
⦁MySQL: Used as the database management system for storing and managing business data.
⦁ETL Processes: Leveraged Python and SQL for extracting and transforming data from various sources.
⦁DAX (Data Analysis Expressions): Used to create calculated columns and measures for advanced analytics.
⦁Power BI Services: Utilized for report publishing, sharing, and automated data refresh.
⦁Snowflake Schema: Adopted for efficient data organization and modeling.
🔍 Key Features of the Dashboard:
✔️ Finance – Profit & Loss insights across customers, products, and countries.
✔️ Sales – Key performance indicators like Net Sales, Gross Margin, and Profitability Trends.
✔️ Marketing – Product performance analysis and growth opportunities.
✔️ Supply Chain – Forecast accuracy, risk management, and operational efficiency.
✔️ Executive View – High-level summaries for leadership decision-making.
Project Implementation
The development of this Power BI dashboard involved several critical steps, including data extraction, transformation, modeling, and visualization. Below is a detailed overview of the technical implementation.
1- Database Design and Setup : The database serves as the central repository for all business data and ensures consistency and reliability across the platform. Developed a Snowflake schema that organizes data into related tables, optimizing for easy retrieval and analytical performance.
2- Data Extraction and ETL Processes : Data was seamlessly extracted from multiple sources, including MySQL databases and Excel files, ensuring that all relevant business data could be ingested into Power BI. Applied ETL (Extract, Transform, Load) processes to clean, standardize, and transform raw data into valuable, actionable insights. These processes ensured data consistency and improved the quality of the reports generated.
3- Data Modeling : Created an advanced data model using the Snowflake schema, which integrated over ten related tables.
This model enables the efficient and accurate analysis of data across various business domains. Developed calculated columns and measures using DAX (Data Analysis Expressions) to allow for complex business calculations and deeper analytical insights.
4- Visualization and Reporting : Designed interactive visualizations using Power BI, including dashboards, charts, tables, and KPIs, that allow users to explore data dynamically. Leveraged features like slicers, bookmarks, and buttons to create user-friendly, interactive reports that allow stakeholders to drill down into specific data points and view customized views. Integrated Power BI Services for report publishing, making it easy to share insights across teams and departments.
5- Automation & Data Refresh : Implemented automated data refresh using Power BI Gateway, ensuring that the dashboard reflects the latest business data without manual intervention. Scheduled automatic updates to keep the reports up-to-date, ensuring executives and teams always have access to the most current information.
⦁Power BI: Used for creating dynamic dashboards, visualizations, and interactive reports.
⦁MySQL: Used as the database management system for storing and managing business data.
⦁ETL Processes: Leveraged Python and SQL for extracting and transforming data from various sources.
⦁DAX (Data Analysis Expressions): Used to create calculated columns and measures for advanced analytics.
⦁Power BI Services: Utilized for report publishing, sharing, and automated data refresh.
⦁Snowflake Schema: Adopted for efficient data organization and modeling.
- You need to login to have access to uploads.
Quote from bsdinsight on 12 April 2025, 11:11Nội dung thông tin của các dashoard hãy xem tại đây
🔗 LIVE Dashboard : https://lnkd.in/dHQJATEJ
🔗 Github : https://lnkd.in/dsFqQCgV
🔗 Video : https://lnkd.in/daZBpTDC
Nội dung thông tin của các dashoard hãy xem tại đây
🔗 LIVE Dashboard : https://lnkd.in/dHQJATEJ
🔗 Github : https://lnkd.in/dsFqQCgV
🔗 Video : https://lnkd.in/daZBpTDC